
A wise man said: “If you want to go to the backend, the database is a part that cannot be ignored.”
Well, Let’s talk about optimizing database performance on my blog, connection pooling should be the suitable first candidate. So what is connection pooling? How to use the connection pool?
Just take a cup of coffee and read my blog.
Database connection
If you followed my blog, you might know about the TCP handshake, but you can read it again to understand it. And obviously, RDBMS databases like MSSQL, MySQL, and Postgresql all support TCP/IP communication protocol as a standard, especially if you connect to remote databases, and have to add SSL/TLS to secure the connection.
See the following figure for the lifecycle of a connection to postgres DB 1:
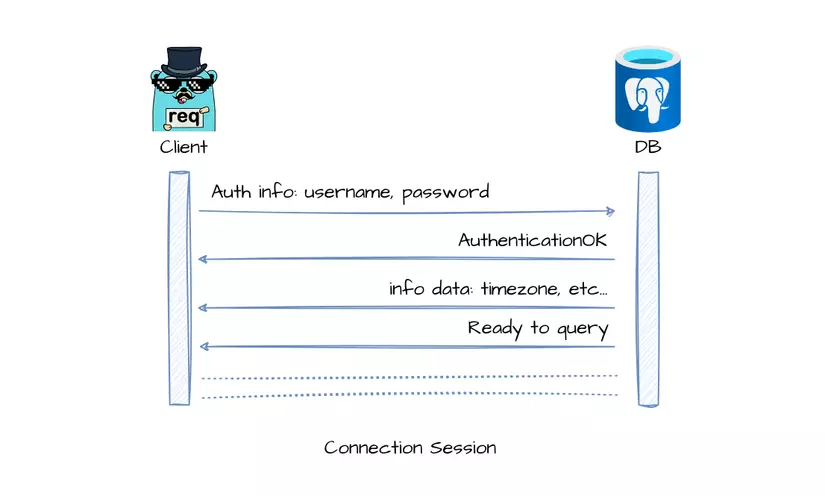
If an application creates a new connection to the database for every incoming request, it will have to perform a handshake again. This consumes resources and slows down the app. Connection pooling was introduced to address this issue.
What is a connection pool?
In essence, the connection pool is an implementation of the Object Pool design pattern. Quite similar to singleton, this is a pattern created with the purpose of being able to reuse the objects we want.
Of course, with expensive operations such as establishing 1 new connection to the DB, this pattern is too reasonable.

Connection pooling is like having boats that ferry people across a river.
If you have to get a new boat from the warehouse every time you need to cross, it takes time and effort.
Instead, you can have a set number of boats moored at the riverbank, and reuse them. This saves time and resources, as you don’t have to keep getting new boats.
When there are no passengers, the boats are stopped and stored until the next time they are needed.
Connection pooling
A database is also software, and be located on the physical server, but then it will also have a limit on the number of connections at the same time.
The default number for the maximum connections in MySQL is 151.
With Postgresql, it would be 100.
MSSQL is more horror with numbers…. 32,767. (It must have cost money 😂)
Within this article, I will only focus on using Postgresql.
How to implement connection pooling?
We basically have two ways to get a connection pool.
- The first way is to install additional software or extensions, such as pgbouncer.
- The 2nd way is to implement connection pooling on the backend layer.
We can implement a pooler simply by using 1 Queue/Stack and 1 mutex Lock, because it’s a design pattern, of course. Refer to the tutorial of Microsoft: Java sample to illustrate connection pooling.
In fact, we don’t need to re-invent the wheel, there are various libraries already supporting it, just use them. Ain’t nobody got time for that! 😎
Connection pooling benchmark
The theoretical lesson is over, let’s move on to the practical one.
First, to prove that connection pooling really boosts performance, I have an idea.
Create a simple API with 3 endpoints that use 3 different methods of accessing database connection:
- Create a new connection for every request.
- Use only one connection for all requests.
- Use a connection pool with a high number of idle connections.
Then I will test these 3 endpoints with both browser and benchmark tool to attack them relentlessly 😎.
Here are a few terms related to the connection pooling that you should be familiar with:
- Connection pool size: The maximum number of connections in the pool should not exceed the maximum number of allowed connections for the database.
- Idle connection: Connections that are in a “idle” state after being used and not released immediately. They are waiting to be reused.
- Connection lifetime: The time that an idle connection will be kept as open without being released.
There is no certainty that idle connections will always live and do not need to be handshaken with the DB for reasons such as timeouts or DB sides. Therefore, it is possible that some libraries implement continuous pinging using idle connections to keep them from being closed at all times. Of course, doing so will take more resources to manage.
Setup a Postgres DB and data
I put the link to my git repository for this benchmark at the end of the post, so I just show the shortened and pseudo-code version. You guys can clone the repo and try it yourself.
To prepare for the benchmark, I created a database with products table:
CREATE TABLE IF NOT EXISTS products (
    id SERIAL PRIMARY KEY,
    name VARCHAR(255) NOT NULL,
    price NUMERIC(10, 2) NOT NULL,
    description TEXT
);
After that, Just go to mockaroo.com to generate a bunch of fake product records:

I just received 1000 rows from mockaroo, then I copied and pasted it to get a bigger dataset into seed.sql.
The fastest way to have a postgres instance is using docker. So I just made this docker-compose.yaml
version: "3.9"

services:
  postgres:
    image: postgres:13.1-alpine
    container_name: postgres_container
    volumes:
      - ./seed.sql:/docker-entrypoint-initdb.d/seed.sql
      - ./data/postgres:/var/lib/postgresql/data
    environment:
      - POSTGRES_DB=${POSTGRES_DB:-postgres}
      - POSTGRES_USER=${POSTGRES_USER:-postgres}
      - POSTGRES_PASSWORD=${POSTGRES_PASSWORD:-password1}
    ports:
      - "5433:5432"
    restart: unless-stopped
To have a pre-populated database with data, simply run the command docker compose up -d. The database will be available on port 5433, and the username and password can be found in the YAML file above.
I chose port 5433 to avoid conflicts with any pre-existing databases on my machine.
Setup a Go API
First should be my device’s spec:
➜  ~ neofetch
Boss Laptop
-----------------
OS: Ubuntu 22.10 x86_64
Host: Latitude 5420
Kernel: 5.19.0-38-generic
CPU: 11th Gen Intel i7-1185G7 (8) @ 4.800GHz
GPU: Intel TigerLake-LP GT2 [Iris Xe Graphics]
Memory: 8862MiB / 31491MiB
Similarly to the DDL products above, I have a Product model:
type Product struct {
	ID          int     `json:"id"`
	Name        string  `json:"name"`
	Price       float64 `json:"price"`
	Description string  `json:"description"`
}
Now we create a model response of the API, which includes two additional fields to estimate the request time.
type Response struct {
	Elapsed  int64      `json:"elapsed"`
	Average  float64    `json:"average"`
	Products []*Product `json:"products"`
}
Let’s continue by declaring a query to select 1000 products from the database, as well as the connection string for the database.
Next, create a connection pool and a singleton connection for the three endpoints I mentioned earlier.
var dsn = "postgres://postgres:password1@localhost:5433/postgres?sslmode=disable"
var query = "SELECT id, name, price, description FROM products limit 1000"

func main() {
	// Postgres allows 100 connections in default
	// Set the maximum number of idle connections in the pool
	idleConn := 50
	// Set the maximum number of connections in the pool
	maxConnections := 90
	// Set the maximum amount of time a connection can be reused
	maxConnLifetime := 2 * time.Minute
	poolConn, err := sqlx.Open("postgres", dsn)
	if err != nil {
		log.Fatalf("Unable to connect to database: %v\n", err)
	}
	defer poolConn.Close()
	poolConn.SetMaxOpenConns(maxConnections)
	poolConn.SetMaxIdleConns(idleConn)
	poolConn.SetConnMaxLifetime(maxConnLifetime)

	// normal connection
	conn, err := sqlx.Open("postgres", dsn)
	if err != nil {
		log.Fatalf("Unable to connect to database: %v\n", err)
	}
	// default will be 2 idle connections
	// so set it to 1 to simulate
	conn.SetMaxIdleConns(1)

	// Initialize the HTTP router
	router := gin.Default()
	router.StaticFile("/", "./index.html")

	// Handlers...

	// Start the HTTP server
	if err := router.Run(":8080"); err != nil {
		log.Fatalf("Unable to start HTTP server: %v\n", err)
	}
}
I chose the sqlx library for this benchmark. With this library, when we make a singleton connection, the connection pool mode is already turned on by default. In order to emulate the state without a pool in other languages and libraries, I set the number of idle connections to 1.
For the case using pool, I set the pool size to 90, the number of idle connections to 50, all of which are substantial quantities, and the lifetime to 2 minutes.
Then, create 3 REST endpoint handlers with the method:GET
products/pooled: Use a connection pool.products/normal: Use a singleton connection for all requests.products/new: Establish new connection for every requests.
As you can see, these 3 endpoints behave exactly the same, with the exception of using a different database connection.
router.GET("/products/normal", func(c *gin.Context) {
		startTime := time.Now()

		// Query the database for all products
		rows, err := conn.Query(query)
		if err != nil {
			c.JSON(http.StatusInternalServerError, gin.H{"error": err.Error()})
			return
		}
		products, err := scanProducts(rows)
		if err != nil {
			c.JSON(http.StatusInternalServerError, gin.H{"error": err.Error()})
			return
		}
		elapsed := time.Since(startTime).Microseconds()
		allCount++
		allTime += elapsed
		c.JSON(http.StatusOK, model.Response{Elapsed: elapsed, Average: float64(allTime / allCount), Products: products})
})

router.GET("/products/pooled", func(c *gin.Context) {
		startTime := time.Now()
		// Query the database for all products
		rows, err := poolConn.Query(query)
		if err != nil {
			c.JSON(http.StatusInternalServerError, gin.H{"error": err.Error()})
			return
		}
		products, err := scanProducts(rows)
		if err != nil {
			c.JSON(http.StatusInternalServerError, gin.H{"error": err.Error()})
			return
		}
		elapsed := time.Since(startTime).Microseconds()
		poolCount++
		poolTime += elapsed
		c.JSON(http.StatusOK, model.Response{Elapsed: elapsed, Average: float64(poolTime / poolCount), Products: products})
})

router.GET("/products/new", func(c *gin.Context) {
		startTime := time.Now()
		conn, err := sqlx.Open("postgres", dsn)
		if err != nil {
			log.Fatalf("Unable to connect to database: %v\n", err)
		}

		rows, err := conn.Query(query)
		if err != nil {
			c.JSON(http.StatusInternalServerError, gin.H{"error": err.Error()})
			return
		}
		products, err := scanProducts(rows)
		if err != nil {
			c.JSON(http.StatusInternalServerError, gin.H{"error": err.Error()})
			return
		}
		elapsed := time.Since(startTime).Microseconds()
		newCount++
		newTime += elapsed
		c.JSON(http.StatusOK, model.Response{Elapsed: elapsed, Average: float64(newTime / newCount), Products: products})
})
Create an index.html file for the purpose of testing on browser:
<body>
<button onclick="getProducts('normal')">Get Products</button>
<button onclick="getProducts('new')">Get Products | New</button>
<button onclick="getProducts('pooled')">Get Products | Connection Pool</button>
<script>
    function getProducts(mode) {
        let lastResult = null;
        const promises = [];
        for (let i = 0; i < 200; i++) {
            promises.push(
                fetch(`/products/${mode}`)
                    .then(response => response.json())
                    .then(({elapsed, average, products}) => {
                        lastResult = {elapsed, average};
                        console.log({elapsed, average});
                    })
            );
        }
        Promise.all(promises)
            .then(() => {
                console.log(`Last result for ${mode}:`, lastResult);
            })
            .catch(error => console.error(error));
    }
</script>
</body>
This code is very simple, with each button press, I will use a promise to asynchronously run 200 requests to the corresponding endpoint.
Benchmark on browser results
Run the app, open the browser, and we have 3 buttons with the response of each request has 1000 products, the response weighs about 86.53 KB.

To maintain stability for the test, each time I run 1 endpoint, I will restart the app to reset the connection pool.
First, we try with the /products/new endpoint, where the connection will be recreated 200 times, after pressing the button, nearly 100 requests have failed:

This is the error message I got:
error "pq: sorry, too many clients already"See! it is a big mistake if we use a new connection for every incoming request.
The average request time at this endpoint is approximate: 6380 microseconds ~ 6.3ms
Continue with the normal button, where a singleton connection is used for every request: /products/normal

Yeah! not see any error request.
Average elapsed time: 5704 microseconds ~ 5.7ms
Then move to the boss /products/pooled:

Yeah, we have an impressive number of 1034 microseconds ~ 1.03ms
Stress test with wrk
You can see the impressive numbers of connection pooling when we run 200 requests on browser side. However, to simulate real-world scenarios where the server receives thousands of concurrent requests, I will use another benchmarking tool: go-wrk.
This tool helps to benchmark more powerfully, supporting the configuration of the benchmark running time and the number of goroutines running simultaneously. This number is proportional to the number of requests sent at the same time.
Install go-wrk:
go install github.com/tsliwowicz/go-wrk@latestSlight stress test
For the first time, I just have a wrk config running 10 seconds by 20 goroutines (you can just simply consider a goroutine as a thread).
Test endpoint /products/new
100 requests in 185.685138ms, 8.46MB read
Requests/sec:           538.55
Transfer/sec:           45.56MB
Avg Req Time:           37.137027ms
Fastest Request:        12.724131ms
Slowest Request:        58.512859ms
Number of Errors:       29433
According to the results, you can see that in addition to the response speed being significantly increased to 37ms, the number of failed requests due to connection exhaustion is also close to 30k. Almost only 100 requests can be processed, equal to the default maximum number of connections of the DB.
Okay, reset the app and test the next endpoint.
Test endpoint /products/normal
Running 10s test @ <http://localhost:8080/products/normal>
  20 goroutine(s) running concurrently
9358 requests in 10.00261655s, 791.59MB read
Requests/sec:           935.56
Transfer/sec:           79.14MB
Avg Req Time:           21.37768ms
Fastest Request:        2.44047ms
Slowest Request:        102.748343ms
Number of Errors:       0
If we use the singleton connection method, only allow 1 idle connection, there is no failure of any request, in 10 seconds get 9358 requests, respond with a time of 21ms.
Test endpoint /products/pooled
20 goroutine(s) running concurrently
17010 requests in 9.98895932s, 1.41GB read
Requests/sec:           1702.88
Transfer/sec:           144.04MB
Avg Req Time:           11.744808ms
Fastest Request:        1.576952ms
Slowest Request:        84.103652ms
Number of Errors:       0
At best, the response time is twice as fast as the singleton method, and also handles up to 17k requests within 10 seconds.
However, I still want to suppress this API a little more, let’s increase the difficulty of the game by increasing the number of goroutines at the bench to 200!
Heavy stress test
You can guess the outcome!
Test endpoint /products/new
100 requests in 51.987238ms, 8.46MB read
Requests/sec:           1923.55
Transfer/sec:           162.71MB
Avg Req Time:           103.974476ms
Fastest Request:        48.576556ms
Slowest Request:        126.737139ms
Number of Errors:       24624
Response time increases significantly!
Test endpoint /products/normal
This one doesn’t seem to be able to handle this huge number of simultaneous requests!
8206 requests in 7.75374229s, 694.15MB read
Requests/sec:           1058.33
Transfer/sec:           89.53MB
Avg Req Time:           188.977389ms
Fastest Request:        2.688429ms
Slowest Request:        965.145213ms
Number of Errors:       3171
Test endpoint /products/pooled
In the end, with the connection pool, only 15 requests failed.
16792 requests in 10.005117575s, 1.39GB read
Requests/sec:           1678.34
Transfer/sec:           141.97MB
Avg Req Time:           119.165287ms
Fastest Request:        2.598255ms
Slowest Request:        1.004313542s
Number of Errors:       15
A little statistic for you to easily imagine:
| Concurent req | /products/new | /products/normal | /products/pooled |
| 20 gouroutine | 37ms 100 req | 21ms 9k req | 11ms 17k req |
| 200 gouroutine | 103ms 100 req 24k failed | 188ms 8k req 3k failed | 119ms 16k req 15 failed |
As you can see, the performance when using connection pooling is most evident when I increase the number of simultaneous requests. Besides, the number of failed requests will also decrease.
However, the trade-off is that requests will have to wait a little longer to wait for the connection from the pool.
How to config the connection pool?
When we set parameters such as the number of idle connections, timeout, maximum number of connections (pool size)…, we must also set it so that:
- No waste of resources
- Do not set it too low, resulting in no increase in performance.
I also learned about this problem, in fact, the maximum number of connections is 90 I set in the code above seems to be overkill. You can see, with only 1 connection, the option has also processed 8k req, half of the endpoint /normal
I checked again with the maximum number of idle connections and max connections of 4, equal to the number of physical cores of my machine.
The result is exactly as I thought, not much different from the numbers 50 and 90.
If deploying to the server, you should set the maximum number of connections as less than or equal to the number of cores/threads of the server.
Conclusion
In the end, connection pooling is a technique that helps increase performance and reduce the rate of error requests.
This technique is very useful with backend systems with a large number of simultaneous requests, so it will be good if you understand and master it.
Happy coding!