
Vscode is a perfect editor for programming. In the previous post, I show you how to install vscode on your machine. But with Java developers or newbies of the Java programming world, Java debugging in vscode is a big question. Let me show you how to do it.
Install Java SDK
You can find and download the SDK from the oracle download page here.
For Linux (Ubuntu) users, it’s easier to install via the command line:
sudo apt install default-jreInstall Java extension pack
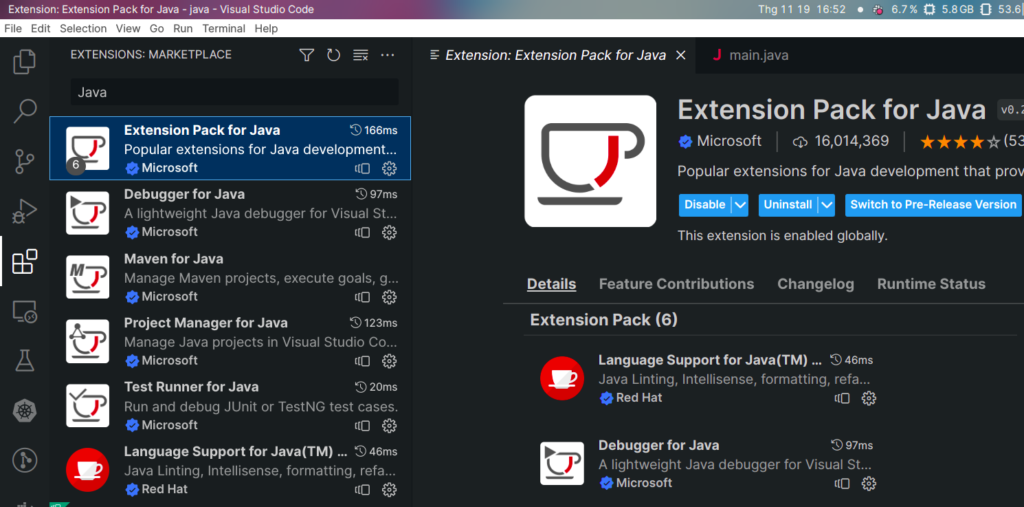
First, we need to install some necessary extensions. Go to the extension tab on the left sidebar and search for Java, you will see the extension pack developed by Microsoft, then click the install button.
This pack included language support, maven support, and intellisense (code suggestion), it’s very essential.
Debug a Java program
Create a new file called Main.java and put the content like:
public class Main {
    public static void main(String[] args) {
        Person person = new Person("Larry", 24);
        System.out.println("Hello");
        System.out.println("Name:" + person.getName());
        System.out.println("Age:" + person.getAge());
    }

    static class Person {
        private String name;
        private int age;

        public Person(String name, int age){
            this.name = name;
            this.age = age;
        }
        public int getAge() {
            return age;
        }
        public String getName() {
            return name;
        }
    }
}
The standard entry point for a Java program is the main function of class Main. Its signature is:
public static void main(String[] args)
Then Vscode will automatically detect the entry point of the program, and put the run and debug button on top of it:
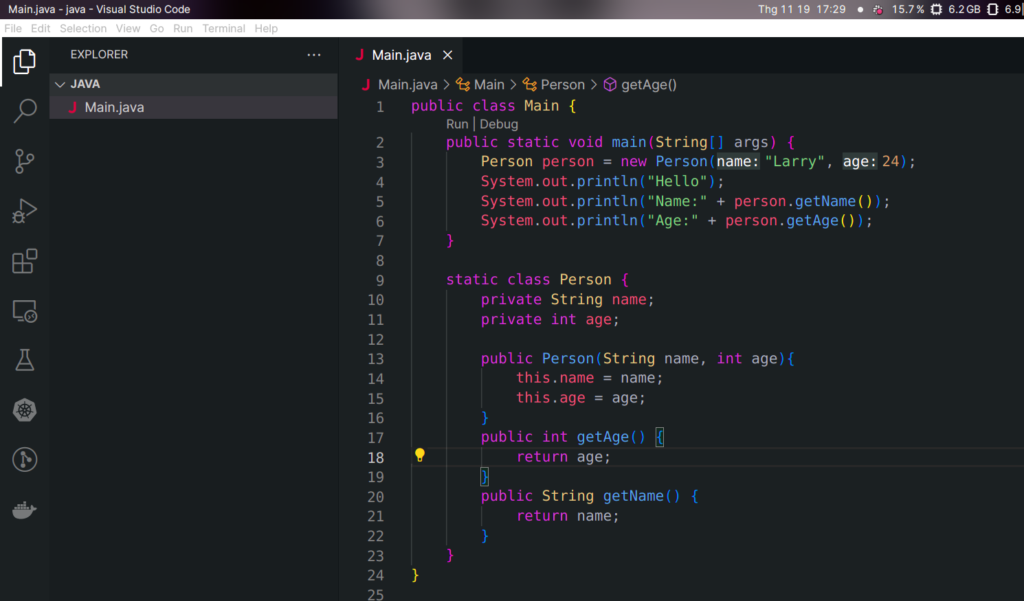
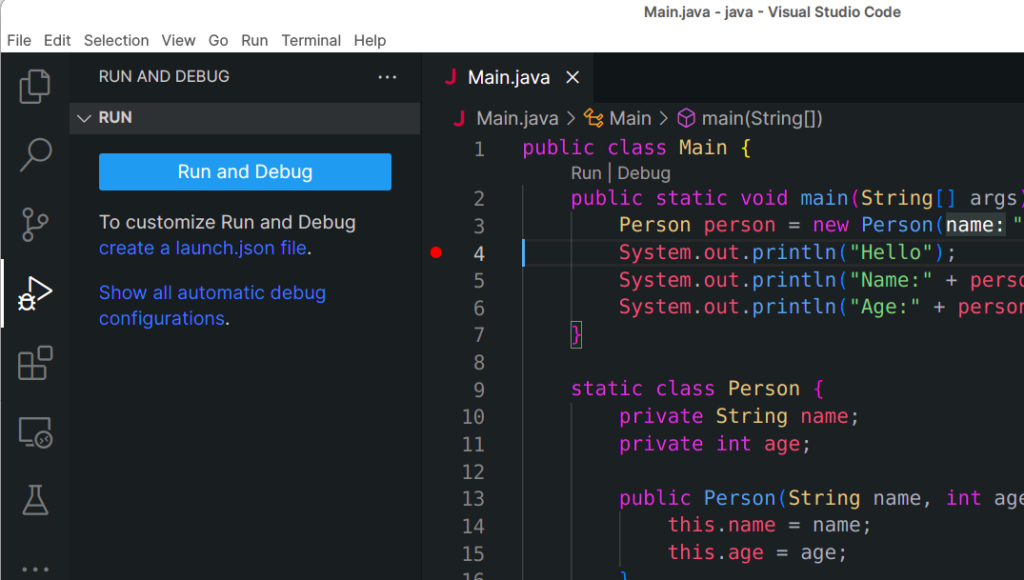
You can put some debugging points on the left of the code editor, (right before the line number) and click on Debug button (or press F5), you will get this:
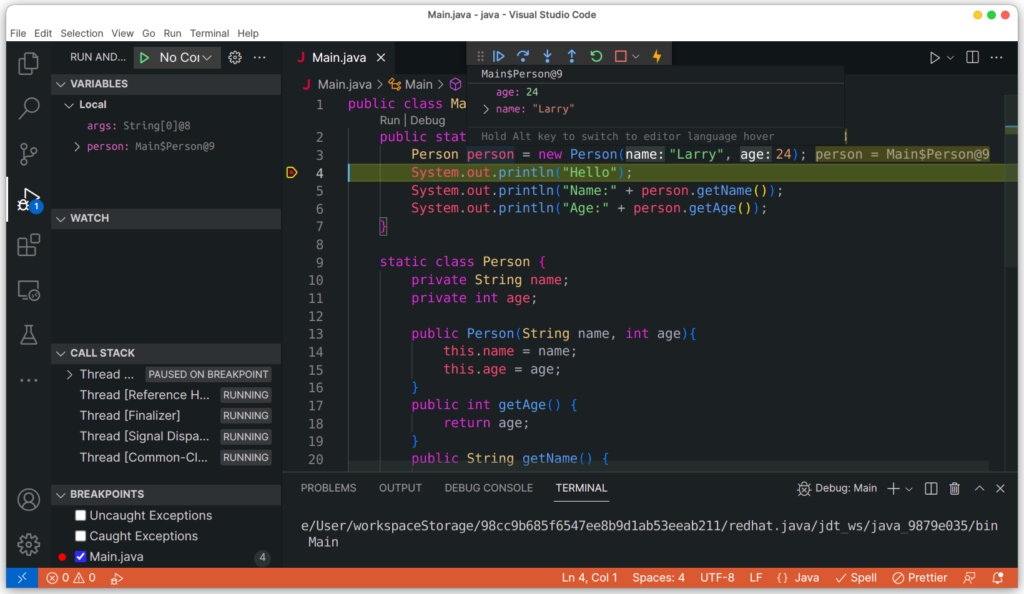
Now here you can see the debugger will stop at the point we put (line 4), now we have:
- The variable tab shows currently available variable values.
- The call stack tab shows the code call stacks.
- The watch tab allows us to put custom variables to watch its value easier.
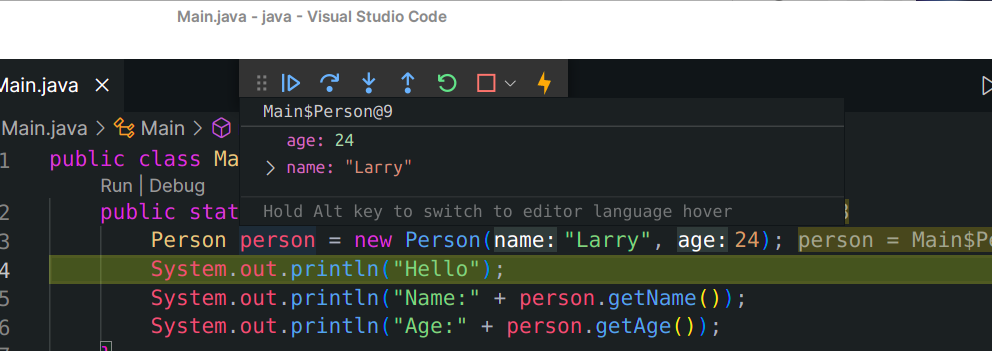
You can move your mouse pointer onto the variable that you want to check, it will display a context tooltip to show its value.
Some helpful shortcuts:
- Continue: F5
- Step Over the current line: F10
- Step into the function: F11
- Step out of the function: Shift + F11
- Restart: Ctrl+Shift+F5
- …
Advanced configurations for Java debugging
Vscode supports us to create a customized debugging profile, you can check it by go to the debugging tab:
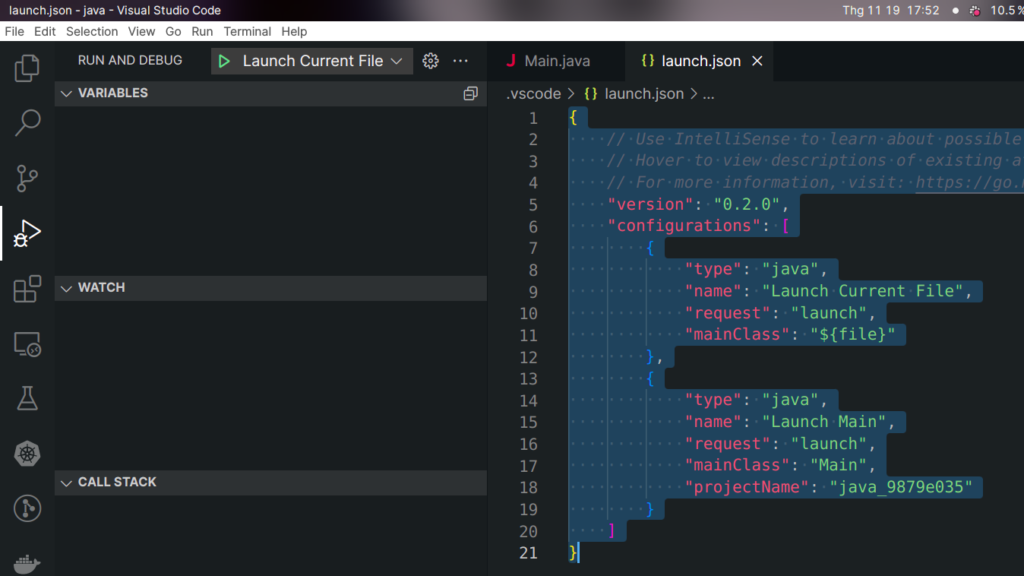
Click on "create a launch.json file" to create a new launch profile, the default value will be:
{
    // Use IntelliSense to learn about possible attributes.
    // Hover to view descriptions of existing attributes.
    // For more information, visit: https://go.microsoft.com/fwlink/?linkid=830387
    "version": "0.2.0",
    "configurations": [
        {
            "type": "java",
            "name": "Launch Current File",
            "request": "launch",
            "mainClass": "${file}"
        },
        {
            "type": "java",
            "name": "Launch Main",
            "request": "launch",
            "mainClass": "Main",
            "projectName": "java_9879e035"
        }
    ]
}
You can now launch debug the program by clicking on the ▶️ button of debugging tab:
You can check more configurations here.
Happy coding!